Sunday, April 24, 2011

Dasymetric Mapping

Dasymetric Mapping is a form of thematic mapping mainly used when graphing data that portrays volume. It uses symbols or color shading to portray the different volumes.

This map shows the population density of the San Francisco Bay Area.
http://geography.wr.usgs.gov/science/dasymetric/

Continuously Variable Proportional Circle Map

These are a type of choropleth map. They are proportional circle maps which use circles to create point data on maps. The circle sizes are proportional to the variable being measured.

This map shows the number of vehicle related deaths in the state. The bigger the circles- the higher the number of deaths.
https://www.e-education.psu.edu/geog486/l5_p5.html

Orienteering Map

Orienteering maps are maps made specifically for competitions. They are very detailed maps of the area where the competition will take place and point out things in the area that will be important for the competition.

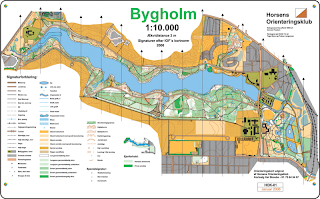
This map shows an area in Northern Denmark with a competition route going through it, and what other physical features competitors can expect to find.
http://en.wikipedia.org/wiki/File:Orienteringskort_bygholm_2005.PNG

DLG

Digital Line Graphs are digital maps that are distributed by the US Geological Survey. They are collected from the USGS maps and are distributed within 9 different categories of physical features.

This map shows contours, roads and lakes using different sets of data acquired from the USGS.
http://web.wt.net/daba/dlg/default.html

Nominal Choropleth Maps

Nominal choropleth maps are used to show nominal values for certain geographical areas. The different colors represent different values, and the values are all classed.
This map shows the accessibility to drinkable water for a state.

http://geoportal.icimod.org/TrainingandEducation/GISforBeginners/p1ch8/

Unstandardized Choropleth Maps

Unstandardized choropleth maps are unordered maps. The classes being mapped are not ranked in relation to each other.

This map shows the most prevalent minority living in each state.
https://courseware.e-education.psu.edu/courses/geog482/graphics/citationexample.jpg

World Aeronautical Chart

World Aeronautic Charts show topographic information, airports and radio navigational aids. They are used by pilots operating at high altitudes.

This is an aeronautic chart of North America.
http://www.flywestwind.com/wtc/charts.htm