Types of Maps
Sunday, February 6, 2011
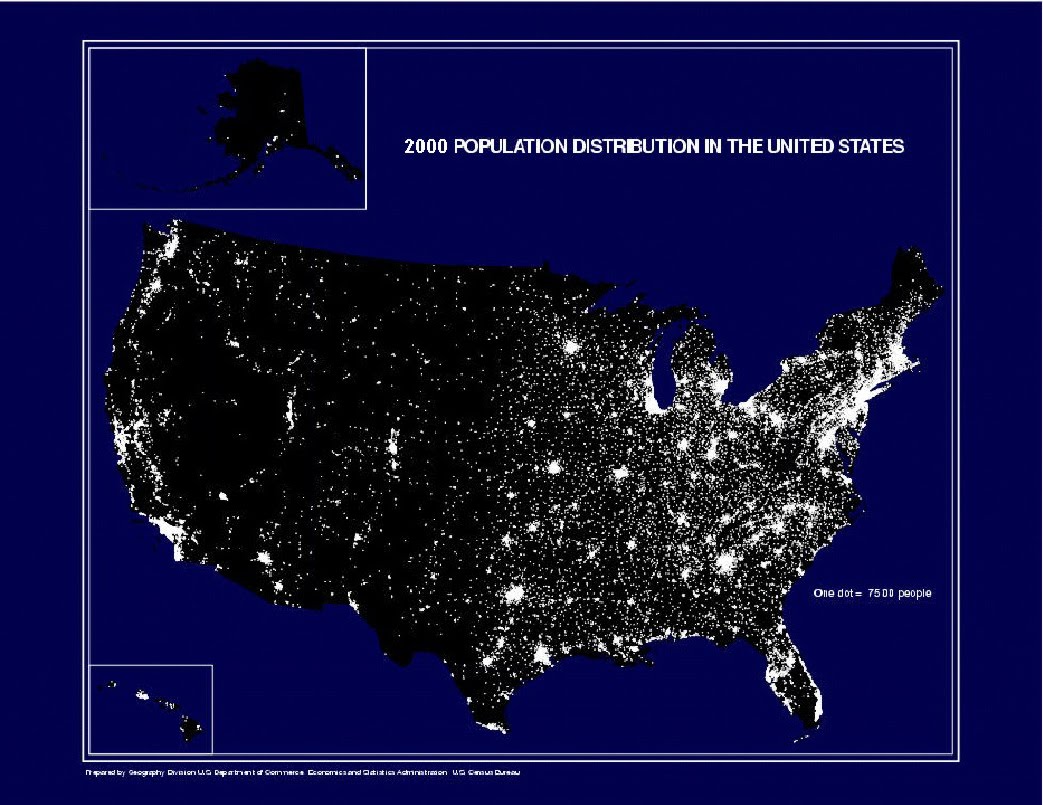
Dot Distribution
A dot distribution map is a thematic map in which dots are used to describe a specific quantity of a given variable.
This map from the US Census Bureau shows population density in the US. The more dots in an area, the more populated it is.
http://www.census.gov/geo/www/mapGallery/2kpopden.html
No comments:
Post a Comment
Newer Post
Older Post
Home
Subscribe to:
Post Comments (Atom)
No comments:
Post a Comment