Sunday, April 24, 2011

DEM

Digital Elevation Maps use stored data about terrain elevation about the earth's surface to create digital models or maps showing the different elevations of an area.

The different shading in this map shows the different elevation of the terrain in the area. The viewer can see the different elevations that the trail goes through.
http://superstition-sar.org/maps.htm

Isopachs

Isopach maps are areal maps that show the thickness variation of the earths surface. They are often used in geology.
http://www.kgs.ku.edu/PRS/Coal/mineral.html

This map shows the different thickness levels of the types of coal in this area.

DRG map

A Digital Raster Graphic (DRG) is a scanned image of a USGS topographic map, and it includes all the map collar information.
They all are made to fit with the Universal Transverse Mercator projection. They are scanned at a minimum resolution of 250 dots per inch.

This is a scanned image showing the geographical location and surroundings of Michigan State University.
http://lter.msu.edu/maps/GIS/DRG_d.jpg

Isopleth Maps

Isopleth maps are used in geography and in meteorology. In geography, isopleths maps are used to generalize data with a continuous distribution.
In meteorology, isopleths is the term used for any type of contour line.
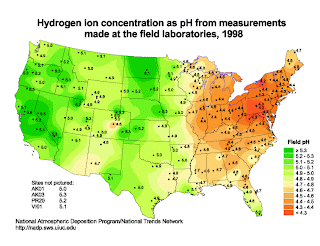
This isopleth map shows the different pH concentration levels across the US. The levels are dotted and the surrounding colors correlate to the different concentration levels.
http://dwb4.unl.edu/chem/chem869v/chem869vlinks/weather.about.com/newsissues/weather/library/weekly/aa071600a.htm

Statistical Map

Statistical maps are also known as distribution maps. They are graphic representations of any quantifiable data that someone has statistics for. This can be anything from how many events an area has to how many geographical features it has to how much rainfall an area gets, etc.


This map uses color to show the average different times that it takes people to drive to work from state to state. The statistic is displayed as a color.
http://mappery.com/map-of/United-States-Travel-Time-to-Work-Statistical-Map

Isoline

Isoline maps uses contour lines to show a common variable on a map. The contour lines can be connecting points of equal temperature (isotherms), pressure (isobars), etc.


This isoline map shows the annual runoff depth of China.
http://www.greenstone.org/greenstone3/nzdl%3Bjsessionid=5ECDCCE4E59E8E65286429EA47AC9289?a=d&d=HASH01815a5264fa0f4bfa328693.10&c=ccgi&sib=1&dt=&ec=&et=&p.a=b&p.s=ClassifierBrowse&p.sa=

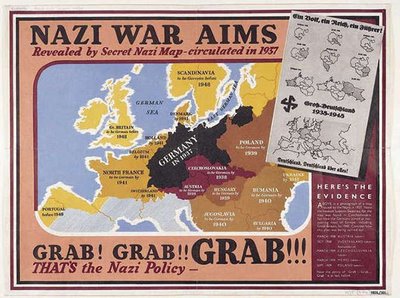
Propaganda Maps

Propaganda Maps are used by people in power to show the control or exploitation of areas. Its often used politically to show national threats.


This map was used during WWII by the British to show the threat that Germany was posing as an expanding power, and showing how they planned on taking over the surrounding countries.